Key Numbers
Financial Indicators
| (€ million) | 2023 | 2022 | Variation (%) | |
|---|---|---|---|---|
|
Change |
Change (at constant scope and exchange rates) |
|||
| Consolidateed sales | 3 937 | 3 642 | + 8.1% | +19.6% |
| EBITDA | 740 | 570 | + 29.8% | +41.0% |
| EBITDA margin (%) | 18.8 | 15.7 | ||
| EBIT | 433 | 284 | +52.1% | +68.0% |
| EBIT margin (%) | 11 | 7.8 | ||
| Consolidated net income | 295 | 175 | +68.3% | +88.1% |
| Net margin (%) | 7.5 | 4.8 | ||
| Consolidated net income, Groupe share | 258 | 156 | +65.6% | +84.8% |
| Cash flow | 589 | 461 | +27.7% | +35.5% |
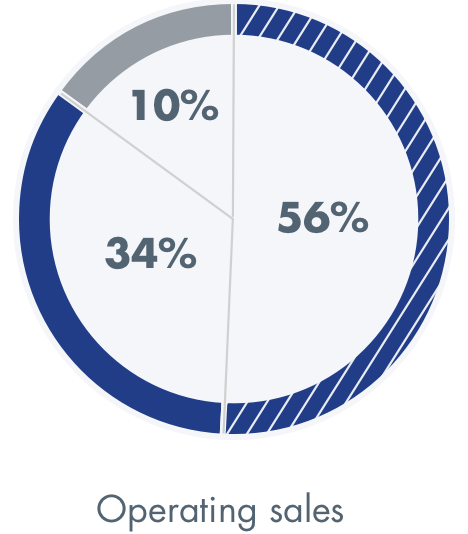
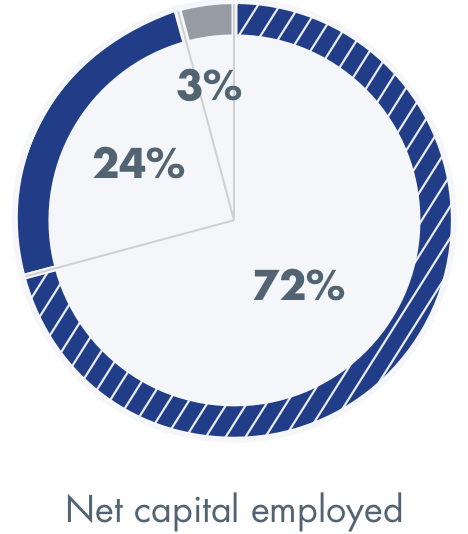
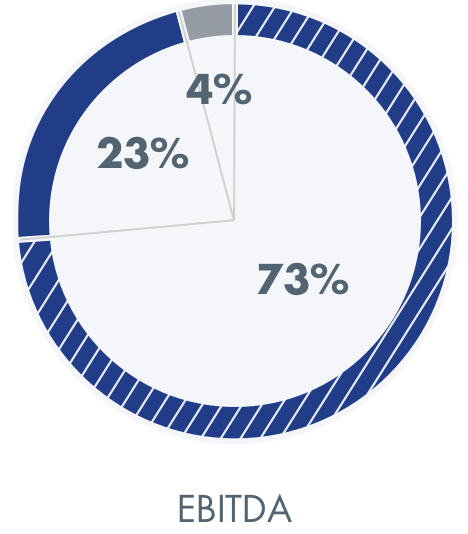
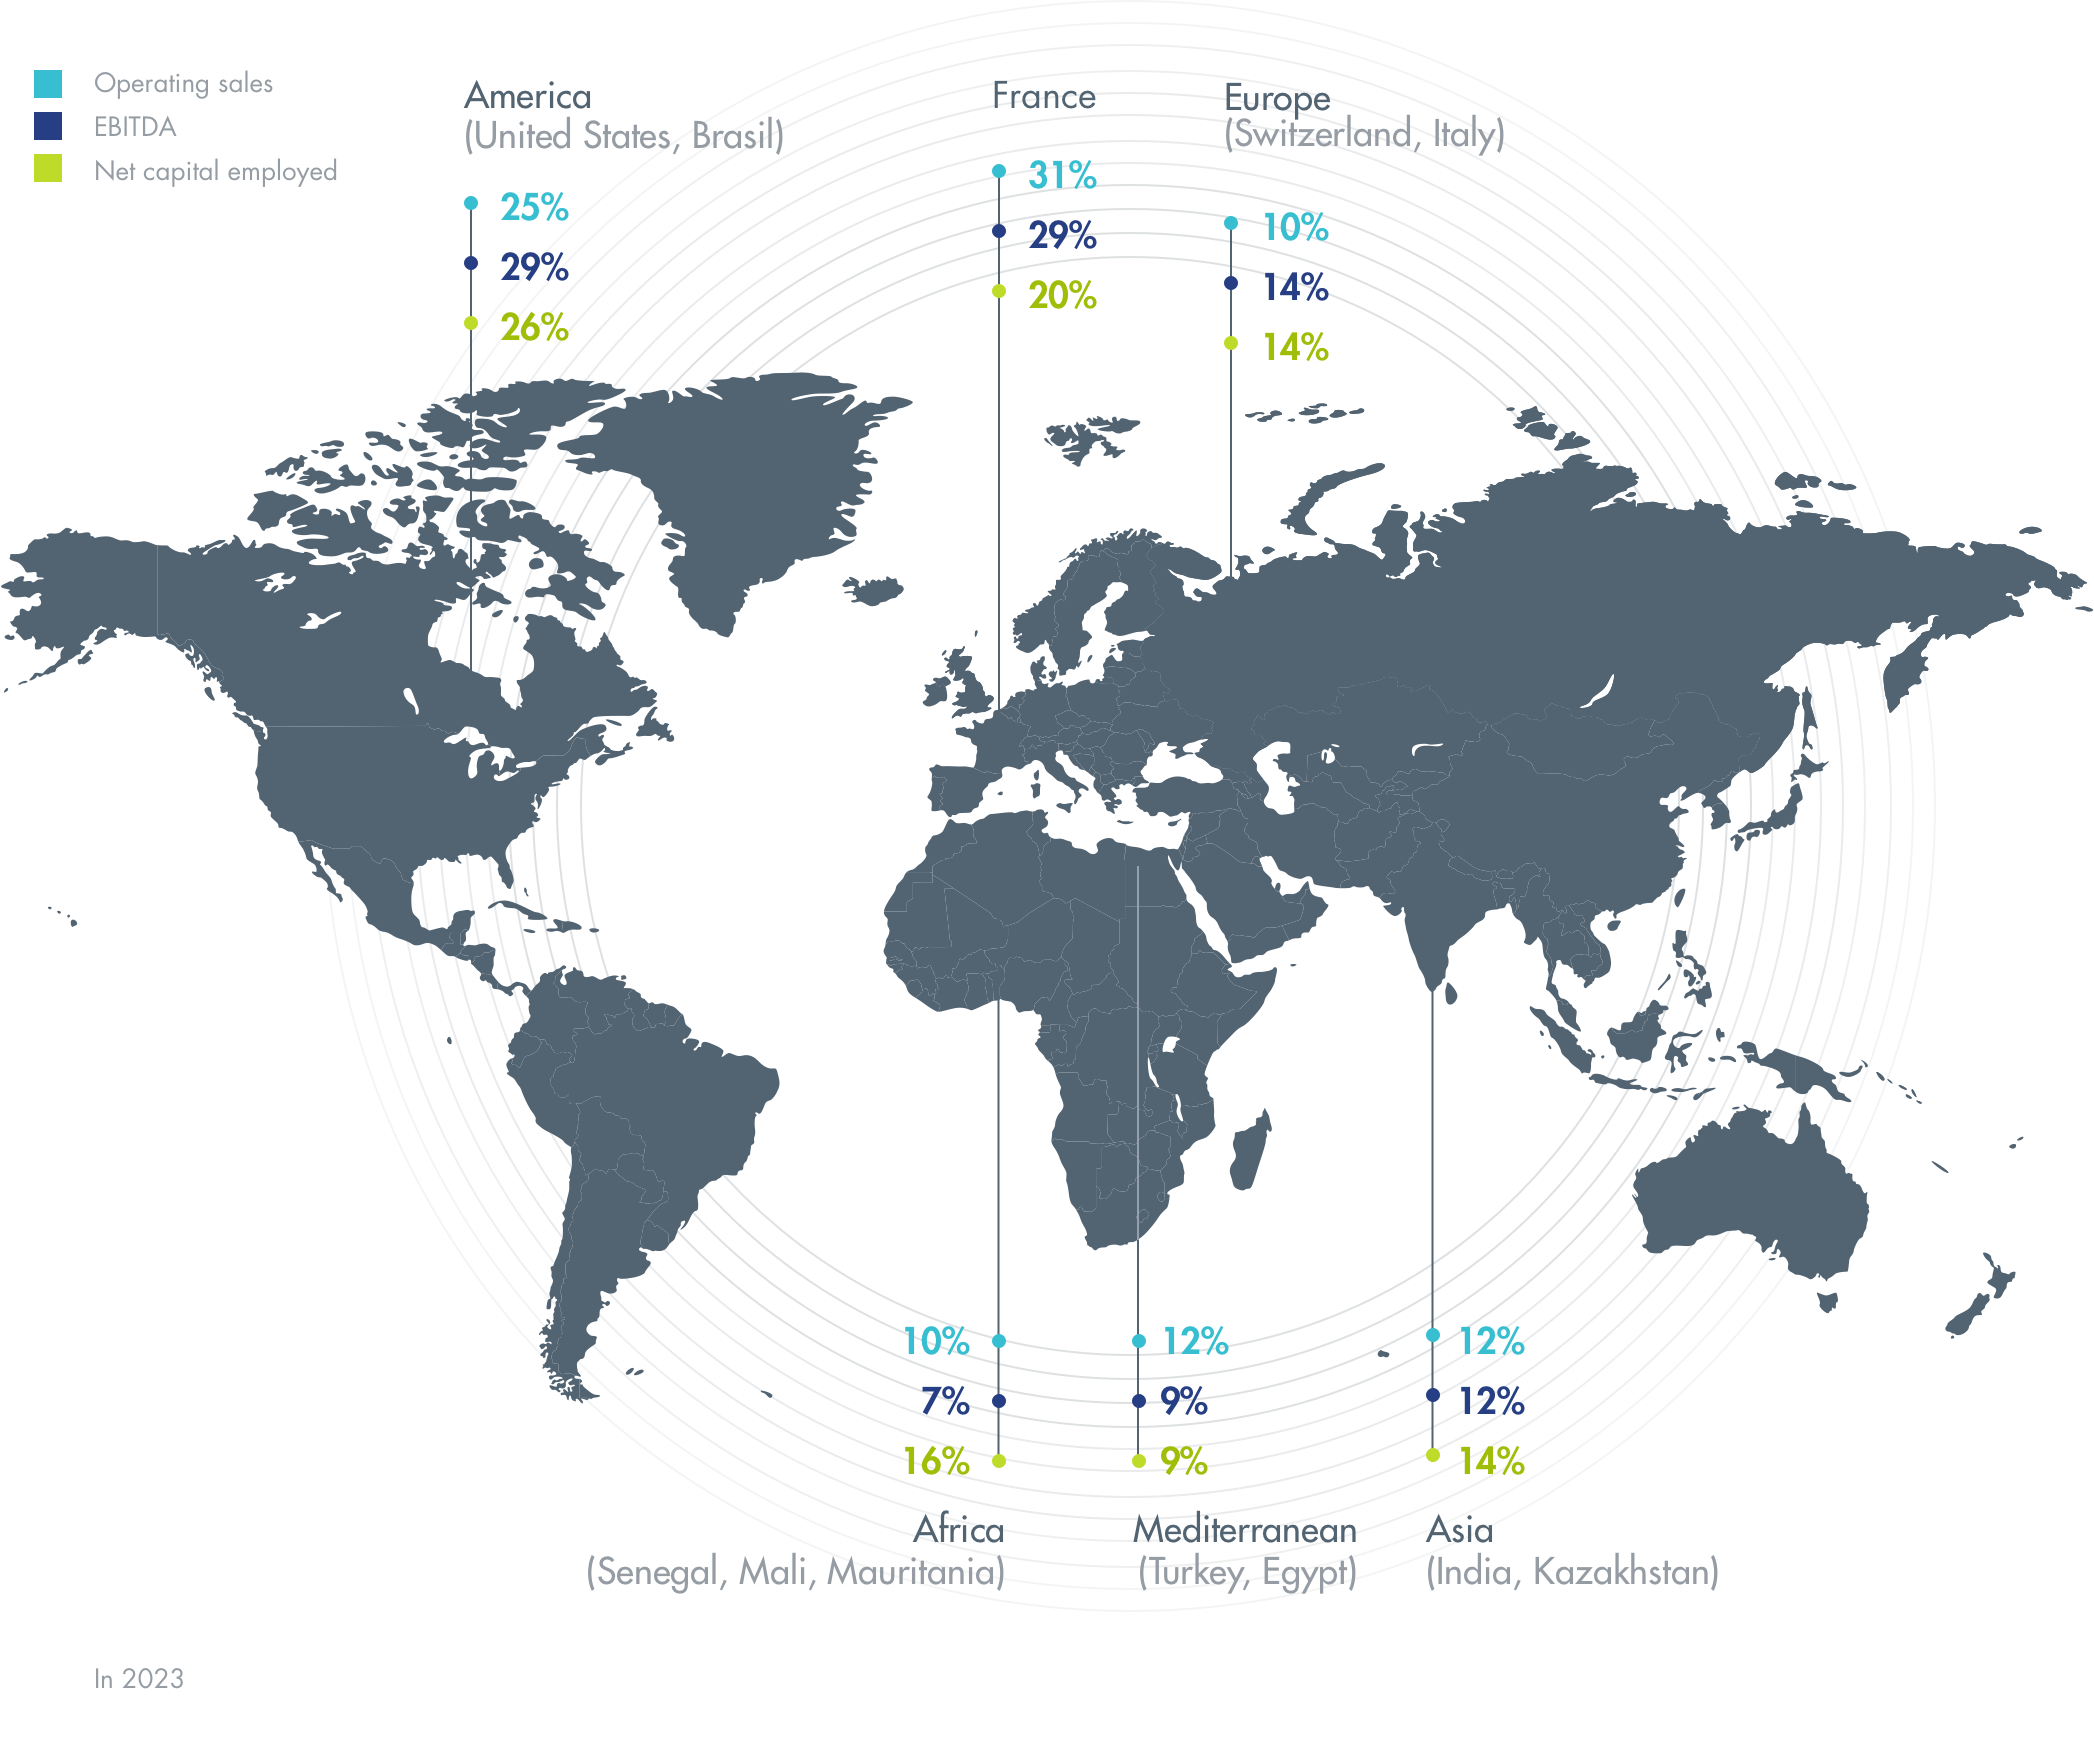
Breakdown per geographical area 2023
Breakdown per business in 2023